For this study, we compared many papers on life cycle analyses of wind turbines and found considerable disagreement and contention about methods. A great study, focused on turbines in the American midwest is . We use the values given in this study, and confirm their size with other sources. These are given in GJ/MW capactity as:
| Turbine | Kenetech (340 kW) | Zond (750 kW) | Tacke (600 kW) | Average | Percent |
|---|---|---|---|---|---|
| Materials production | 4162 | 6358 | 8303 | 6274 | 62.93 |
| Materials transportation | 604 | 484 | 400 | 496 | 4.97 |
| Construction | 612 | 855 | 1069 | 845 | 8.47 |
| Operation and Maintenance | 2892 | 1584 | 1320 | 1932 | 19.37 |
| Decommisioning | 306 | 427 | 534 | 422 | 4.23 |
| Total | 8576 | 9708 | 11626 | 9970 |
In , Table 5 shows estimated material requirements per megawatt of capacity of representative wind technologies. From , we can extract approximate intensities of refining these materials. The results are summarized below:
| Material | kg/MW installed | MJ/kg embodied | MJ/MW installed |
| Steel and Stainless Steel | 115,000 | 20.1 | 2,311,500 |
| Concrete | 590,000 | .75 | 442,500 |
| Fiberglass | 9,800 | 100 | 980,000 |
| Miscellaneous (Alum., plastic, epoxy, foam, and wood) |
8,050 | ~100 (155, 80, 137, 88, 18) | 805,000 |
| Copper | 2,500 | 42 | 105,000 |
| Cast iron | 23,900 | 25 | 597,500 |
| Total | 5,241,500 |
As a double check, we take the materials data from for a 3 MW turbine and estimate the materials embodied energy. The result (per MW of capacity) is 5852 GJ, a similar figure to our first estimation.
| component | material | quant | unit | intensity (GJ/t) | total energy (GJ) | |
|---|---|---|---|---|---|---|
| foundation | ||||||
| concrete | 1140 | t | 1.77 | 2022.26087 | ||
| steel | 36 | t | 35 | 1260 | ||
| tower | 0 | |||||
| steel | 158.76 | t | 35 | 5556.6 | ||
| paint | 1.24 | t | 400 | 496 | ||
| nacelle | 0 | |||||
| steel | 61 | t | 35 | 2135 | ||
| copper | 3.75 | t | 379 | 1421.25 | ||
| aluminum | 2.311 | t | 252 | 582.372 | ||
| plastic | 0.7 | 80 | 56 | |||
| rotor | 0 | |||||
| steel | 19.93 | t | 35 | 697.55 | ||
| fiberglass | 12.04 | t | 168 | 2022.72 | ||
| epoxy | 8.03 | t | 163 | 1308.89 | ||
| 17558 | ||||||
| 5852 | embodied energy (GJ) per MW of capacity |
Both of these figures are comparable to our primary source .
For manufacturing, we have the turbine specific manufacturing steps, transport, and installation. For instance, let's look at transport. Assuming all shipping is by road freight, we can estimate the energy intensity of this using statistics from (Table 1-05 and 4-06) and (Chapters 2 and 5). We get values between 1 and 1.6 MJ/km/tonne for road freight shipping.
Now we use to generate an example supply chain for a 2 MW turbine, shown below, with installation site near Augspurger Mountain in central Washington, and shipping intensity 1.3 GJ/km/tonne.
| Origin | Distance (kilometers) | Mass (tons) | Mass (tonnes) | km-t | Transport Energy (GJ) | |
|---|---|---|---|---|---|---|
| Blades + Rotor | Windsor, CO | 1945 | 25.55 | 23.17385 | 45073.13825 | 58.59507973 |
| Tower | Pueblo, CO | 2205 | 165 | 149.655 | 329989.275 | 428.9860575 |
| Nacelle, Gearbox, Generator, Yaw/pitch system | Brighton, CO | 1931 | 51.38 | 46.60166 | 89987.80546 | 116.9841471 |
| Foundation | Lafarge, Seattle, WA | 321 | 788 | 714.716 | 229423.836 | 298.2509868 |
| 902.8162711 |
We see that transportation contributes around 450 GJ/MW of capacity, very close to . Independent sources for the other sectors were harder to construct, so given close agreement with , we accepted those values.
Much of this analysis is confirmed and updated in , extending the work to more modern studies and larger turbines.
In , Table 2 shows main material constituents of wind turbine components, along with energy content. We graph this data in below. We see, the steel tower requires roughly 43% of the total energy invested in the turbine.
The tower stands out as a huge source of energy inputs for the turbine. To support the massive bending load, thick, steel cylindrical sections are used. cites several reasons why tower designs may often be structurally suboptimal, including transportation constraints of towers with large base diameters. Towers with large base diameter could be made thinner while meeting design requirements and offer significant material energy savings. The authors offer an on-site spiral welding technique capable of producing optimized geometries without being subject to transportation constraints.
also synthesizes 72 energy and CO2 analyses of wind turbines and extracts average trends. Comparing these results with scaling laws, we see the average normalized (20 year lifetime, 25% capacity factor) energy intensity of a wind turbine of 1 MW capacity is .05. That is, the turbine generates 20 times more energy than is required to manufacture, install, operate, and dispose of it. This intensity is proportional to as $P^{-.18}$, where $P$ is the nameplate power capacity.
Clearly, this last graph suggests bigger wind turbines have better energetic returns. To make these economical, we must address cost scaling.
To see all turbine system components by cost, we use data from , based on a 45 meter blade radius on a 100 meter tower (roughly 3 MW).
Again, we see the tower is the largest contributor, this time to cost. Here it is followed closely by the blades. In the next section we analyze scaling of blade cost.
Of the material input, we can look at the cost and mass breakdown by component. contains a very nice analysis of this, citing turbines with blade lengths (turbine radii) of 30, 50 and 70 meters. We extract scaling laws from these data points for the graphs below.
We see the fiberglass and resin for the skins and shear webs make up a significant portion of the material cost.
Similarly, the labor to produce these components dominates the cost. Due to amortization over many blades (400 in this study), the per-blade and per-MW tooling costs are amazingly low.
We can combine these broad categories to estimate overall costs.
explores the trade-offs between aerodynamic and structural performance of thickening blade sections.
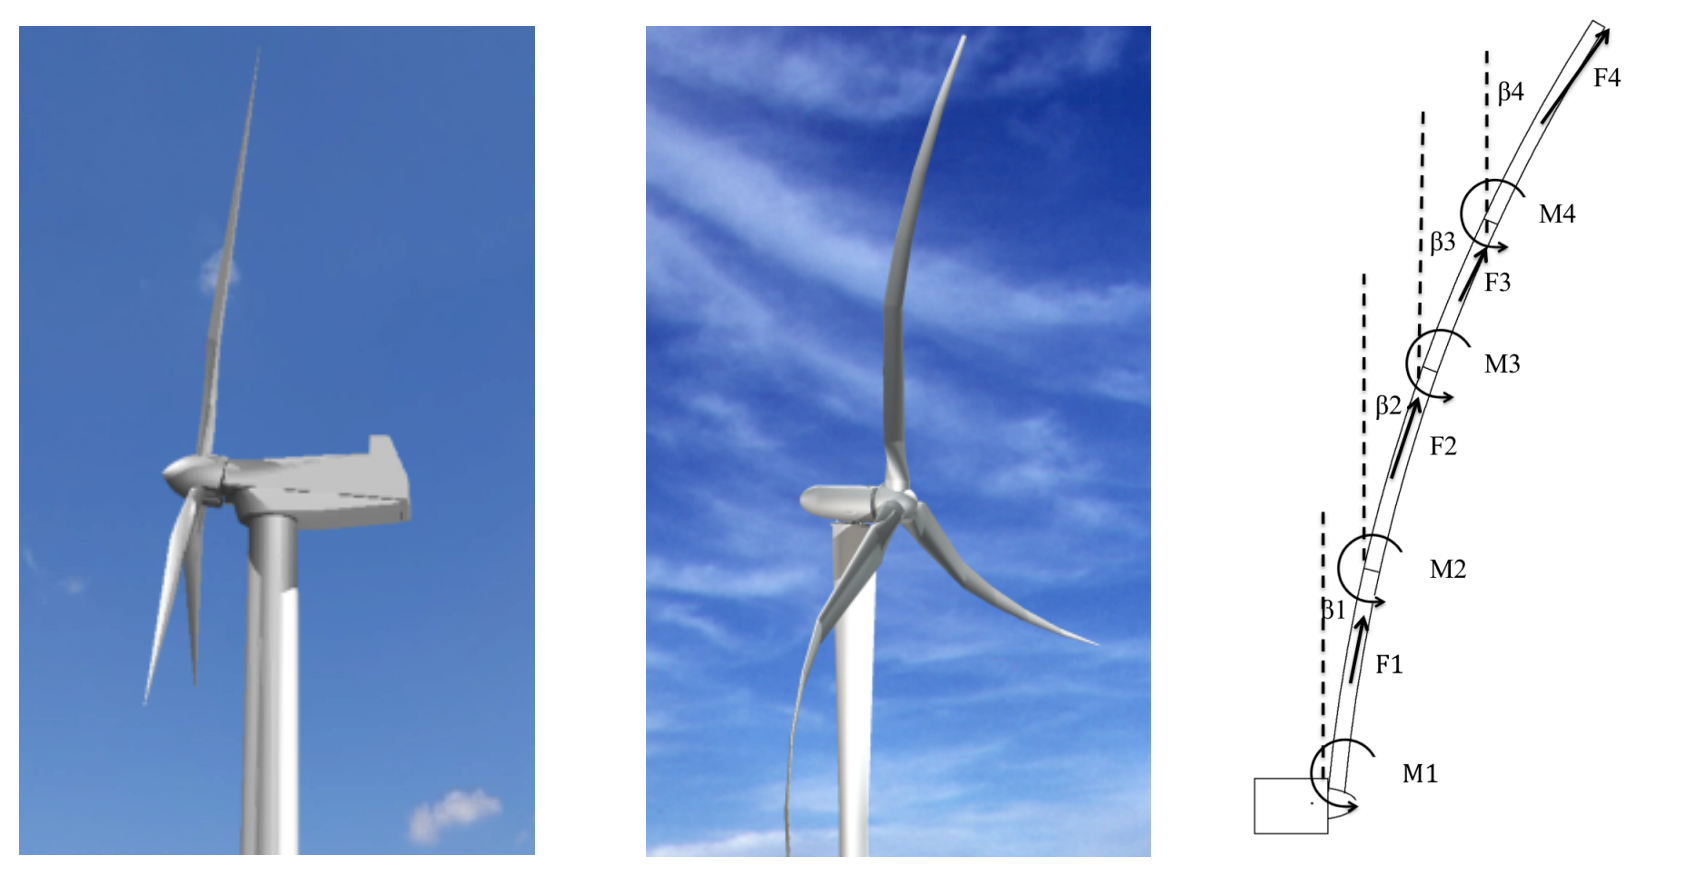
I've found the concept of an interesting take on rewriting these scaling laws. Downwind turbines don't have a tower strike constraint, and so can accomodate significantly coned blades. These blades must be longer to present an equivalent diameter to the wind, but the strains seen in the blade are dramatically reduced. As such, the mass of the blade can be reduced, which triggers a cascade of savings through the system.
uses analytic gradients in turbine system optimization. They are skeptical of blades with purely downwind coning (the mass savings are only modest), but note that an active coning mechanism would be extremely advantageous. describes a 13 MW turbine using lockable joints to adapt the coning to wind conditions. This offered one-third mass reduction while still capturing the same average power in simulation. describes the advantages of downwind turbines, especially for offshore applications. The effects of wind shadowing on power output are noted to generally be small for well designed turbines.
Back